biztory-campaign-data-visualization-2021-record-breaking-year-1080x1080-viz-v2

Watch the growth 🚀

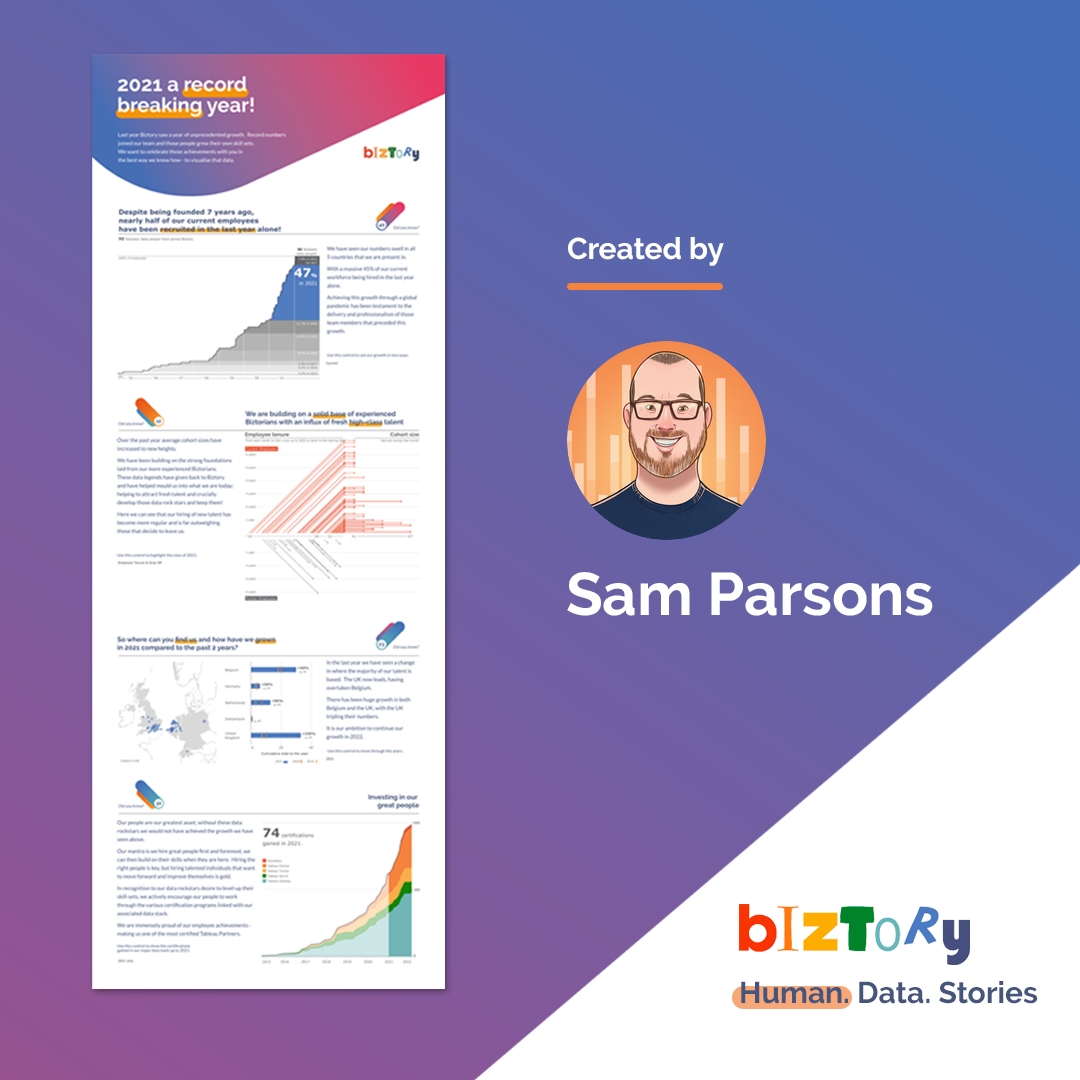
We're proud to share our growth summary in an interactive infographic created with Tableau.

Our very own Sam Parsons - who's a Tableau Zen Master & Iron Viz 2021 Global Runner-up - created this fantastic growth visualisation. 

View the full infographic
biztory-campaign-data-visualization-2021-record-breaking-year-1080x1080-bottle-v2

A gift for a few lucky ones

Biztory crafted a delicious spiced rum. It matches perfectly with a mixer of your choice.
 
Want to taste this exclusive rum? We got you! Answer a few questions about the interactive infographic and maybe you're one of the lucky ones. 
 
Win a delicious treat!

Are you one of the lucky winners?


Psssst... never miss out!

We'll keep you updated* with our latest knowledge and share our newest events (e.g. training, webinars).
 
*You receive max. two newsletters a month, and you can unsubscribe at any time.